- grafana.com
Faster fixes, less context sharing: how Grafana Assistant learns your infrastructure before you even ask
Grafana Assistant introduces automatic infrastructure mapping, building a persistent knowledge base of services, metrics, and dependencies from existing telemetry data. This eliminates manual context …

- grafana.com
Grafana Assistant now automatically builds and maintains a persistent knowledge base of users' infrastructure by analyzing existing telemetry data from Prometheus, Loki, and Tempo. This preloaded cont
- Featuregrafana.com
Grafana upgrades nested tables with flexible grouping rules and field overrides
Grafana Labs introduced significant upgrades to its table visualization’s nested rows feature, including a redesigned transformation editor for Group to nested tables and the ability to apply field ov…
- grafana.com
Pricing change detected for Grafana
Pricing updated for Grafana: - Grafana Cloud Pro (Platform Fee): allowance changed from Platform fee includes 10k active series/month (metrics), 50 GB ingested/month (logs/traces/profiles), 2,232 host…
- Featuregrafana.com
Customize preconfigured views for AWS, Azure, and Google Cloud with Cloud Provider Observability in Grafana Cloud
Grafana Cloud now allows users to customize preconfigured dashboards for AWS, Azure, and Google Cloud services. Users can connect existing dashboards, generate AI-created dashboards, or edit instance …
- Featuregrafana.com
Grafana Cloud now allows users to customize prebuilt dashboards and drill-down views for AWS, Azure, and Google Cloud. Users can connect existing dashboards, generate AI-created dashboards, or edit in
- Featuregrafana.com
Time series to table transformation is now generally available
Grafana Labs announced the general availability of the time series to table transformation, converting time series query results into table rows with trend fields and sparkline cell types for compact …
- Featuregrafana.com
Normalize span names with Adaptive Traces semantic conventions
Grafana Labs introduced span name normalization in Adaptive Traces to align with OpenTelemetry semantic conventions during ingestion. High-cardinality names like /api/users/7f3a are collapsed into sta…
- Featuregrafana.com
Secure performance testing at scale: Introducing secrets management for Grafana Cloud k6
Grafana Cloud k6 now offers secrets management to securely store and inject sensitive values like API keys and tokens into performance tests at runtime. This prevents hardcoding secrets in scripts, re…

- Launchgrafana.com
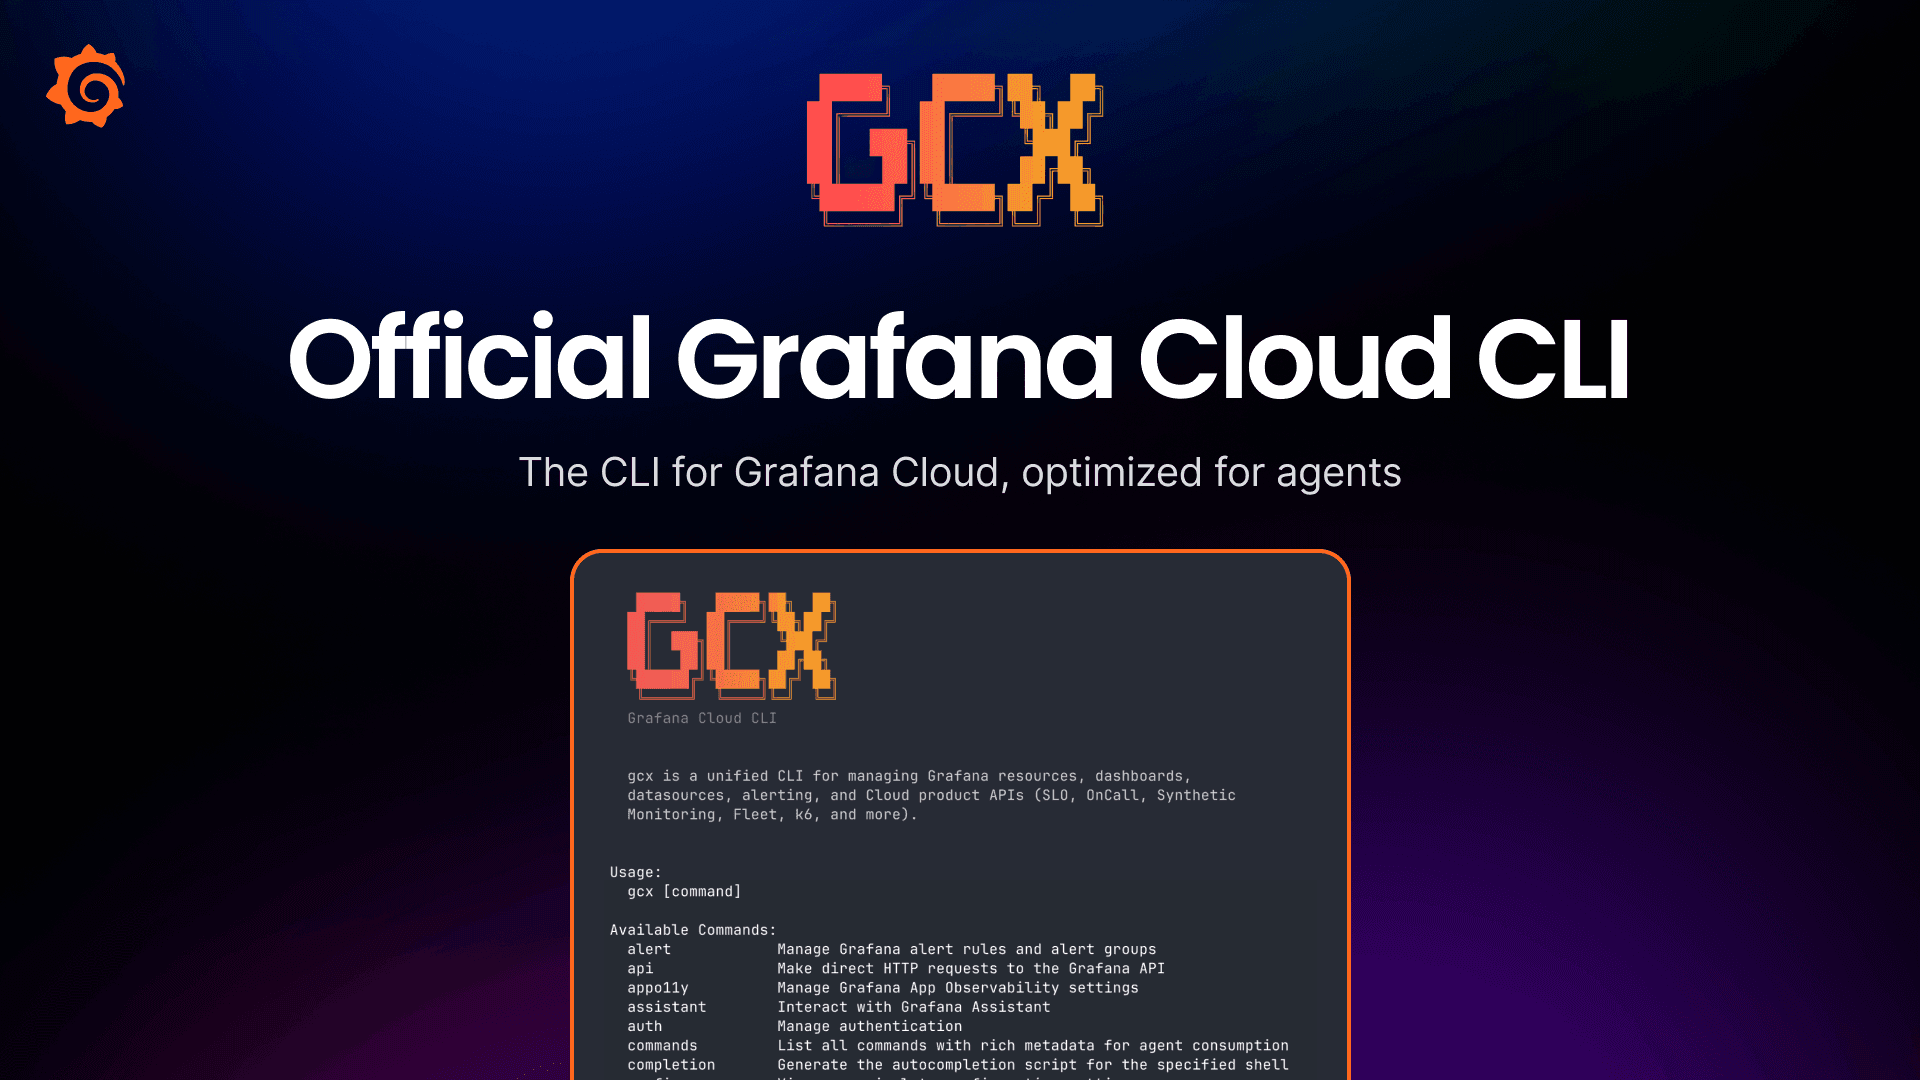
Get observability in the terminal, for you and your agents, with the gcx CLI tool
Grafana introduced gcx, a new CLI tool for Grafana Cloud that integrates observability directly into the terminal and agentic coding environments. It enables agents to access production context, reduc…
- grafana.com
Grafana introduced gcx, a new CLI tool in public preview that integrates Grafana Cloud and Grafana Assistant directly into the terminal and agentic coding environments. It enables engineers and AI age
- grafana.com
Grafana introduced gcx, a public preview CLI tool for Grafana Cloud that integrates observability directly into the terminal and agentic coding environments. It enables agents to access production con
- Featuregrafana.com
End-to-end incident response without leaving Slack
Grafana Labs released an update to its Slack app enabling full incident response workflows directly in Slack, including incident declaration, management, and resolution. Key additions include a new Ap…
- Featuregrafana.com
Use volumetric sampling
Grafana Labs released volumetric sampling in public preview for Adaptive Traces, replacing probabilistic sampling to distribute trace budgets more evenly across services. The policy automatically adju…
- grafana.com
Sample every service fairly with Adaptive Traces volumetric sampling
Grafana Labs launched Adaptive Traces volumetric sampling in Grafana Cloud, enabling fair sampling across all services regardless of traffic volume. This prevents low-volume services from being underr…
- Featuregrafana.com
Editable working hours for Grafana IRM
Grafana IRM now allows users to define custom working hours, visible in on-call schedules. The feature includes per-day toggles, up to three time ranges per day, and one-click configuration copying. S…
- Featuregrafana.com
Build custom Alloy pipelines without writing Alloy syntax
Grafana Labs introduced a no-code Alloy component editor in Grafana Fleet Management, allowing users to build and update Alloy configuration pipelines without writing syntax. The editor provides a sea…
- Featuregrafana.com
FOCUS: Standardized Cost and Usage Data
Grafana Labs released FOCUS (FinOps Open Cost and Usage Specification) v1.2 support in its Cost Management and Billing app, enabling standardized export and analysis of cloud cost and usage data. Feat…
- Eventgrafana.com
Register today!
GrafanaCON 2026, an in-person conference scheduled for April 20-22 in Barcelona, Spain, will showcase upcoming developments in Grafana and the open source LGTM (Loki, Grafana, Tempo, Mimir) stack, inc…

- Featuregrafana.com
Grafana dashboards as code: How to manage your dashboards with Git
Grafana 13 now offers Git Sync, a native feature for managing dashboards as code directly within Grafana. It enables saving dashboards to Git repositories, creating pull requests for changes, and revi…
- grafana.com
Pricing updated for Grafana: - Grafana Cloud Pro (Metrics): $6.50/mo → Custom pricing - Grafana Cloud Pro (Metrics): allowance changed from 10k active series per month then pay as you go to 10k active
- Featuregrafana.com
Anomaly Alerts (Usage Spike Detection)
Grafana Labs introduced Anomaly Alerts in Grafana Cloud’s Cost Management and Billing app, now generally available. The feature detects unexpected spikes or drops in usage by comparing current activit…
- Featuregrafana.com
End-to-End Root cause: Jump from a Synthetic Monitoring check straight to its trace
Grafana Labs introduced a feature linking Synthetic Monitoring checks directly to distributed traces in Grafana Cloud Traces. When a Scripted check fails or shows latency, users can now click a single…
- Featuregrafana.com
Grafana Assistant everywhere: Customize and connect to the AI agent to fit your specific needs
Grafana announced major expansions to Grafana Assistant, transforming it from a cloud-only AI agent into an 'anywhere agent' accessible to Grafana Enterprise, Grafana OSS, and self-managed users. The …
- Launchgrafana.com
GrafanaCON 2026 announcements: A guide to all the latest news from Grafana Labs
Grafana Labs unveiled Grafana 13 at GrafanaCON 2026 in Barcelona, introducing features to accelerate time-to-insights, including suggested dashboards, dynamic dashboards, and AI-powered Grafana Assist…
- Launchgrafana.com
Grafana Labs Targets the “AI Blind Spot” with New Observability Tools Announced at GrafanaCON 2026
Grafana Labs unveiled AI Observability in Grafana Cloud, a public preview tool to monitor and evaluate LLM-powered applications in real time, addressing AI's 'blind spot' in production. The company al…
/)
- Launchgrafana.com
Grafana Labs unveiled Grafana 13, featuring AI-powered Grafana Assistant for all users, dynamic dashboards, Git Sync for GitOps, and Grafana Advisor for system health. The release accelerates time-to-
- Launchgrafana.com
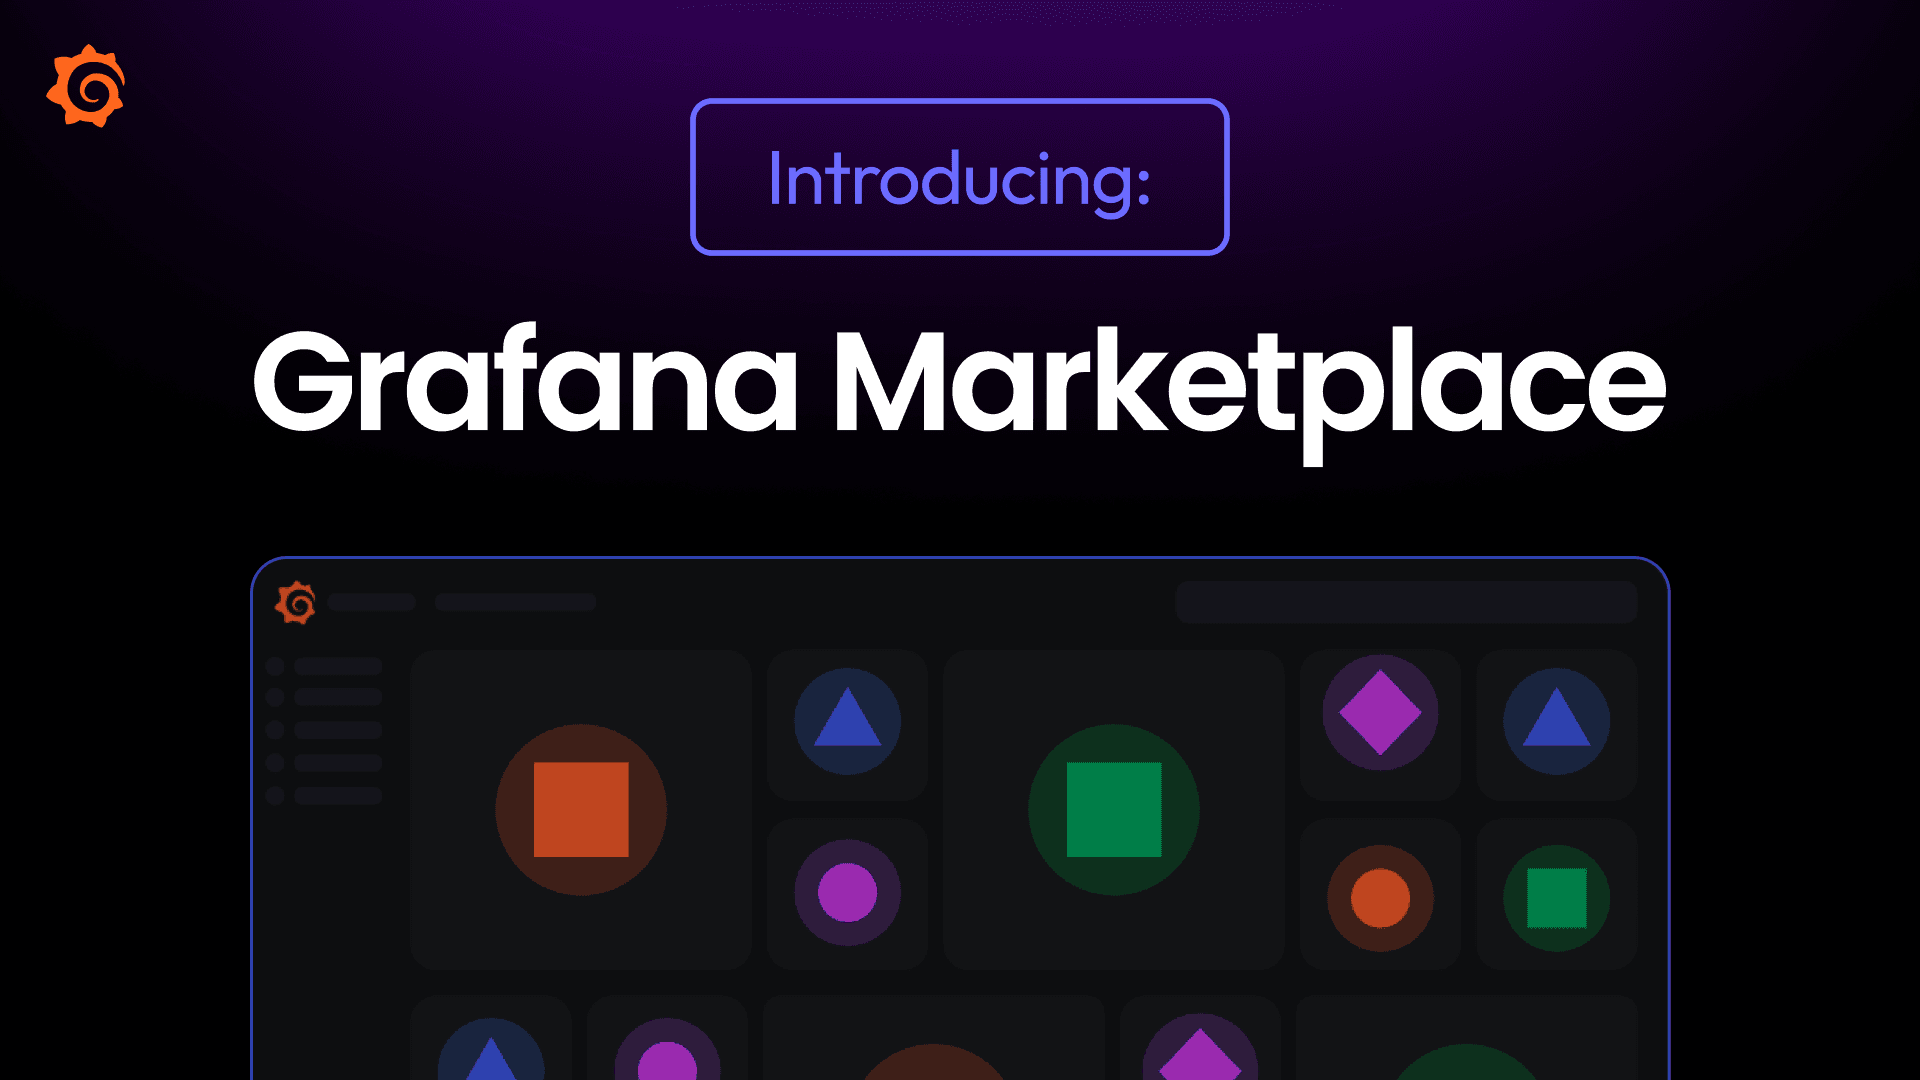
An early look at the Grafana Marketplace: Expanding the big tent
Grafana Labs launched a pilot for the Grafana Marketplace, a new platform enabling third-party developers and partners to sell and distribute plugins for Grafana. The marketplace introduces paid, comm…
- Launchgrafana.com
Introducing Pyroscope 2.0: faster, more cost-effective continuous profiling at scale
Grafana released Pyroscope 2.0, a major rearchitecture of its open-source continuous profiling database designed to reduce costs and improve scalability at scale. The update eliminates write-path repl…

- Launchgrafana.com
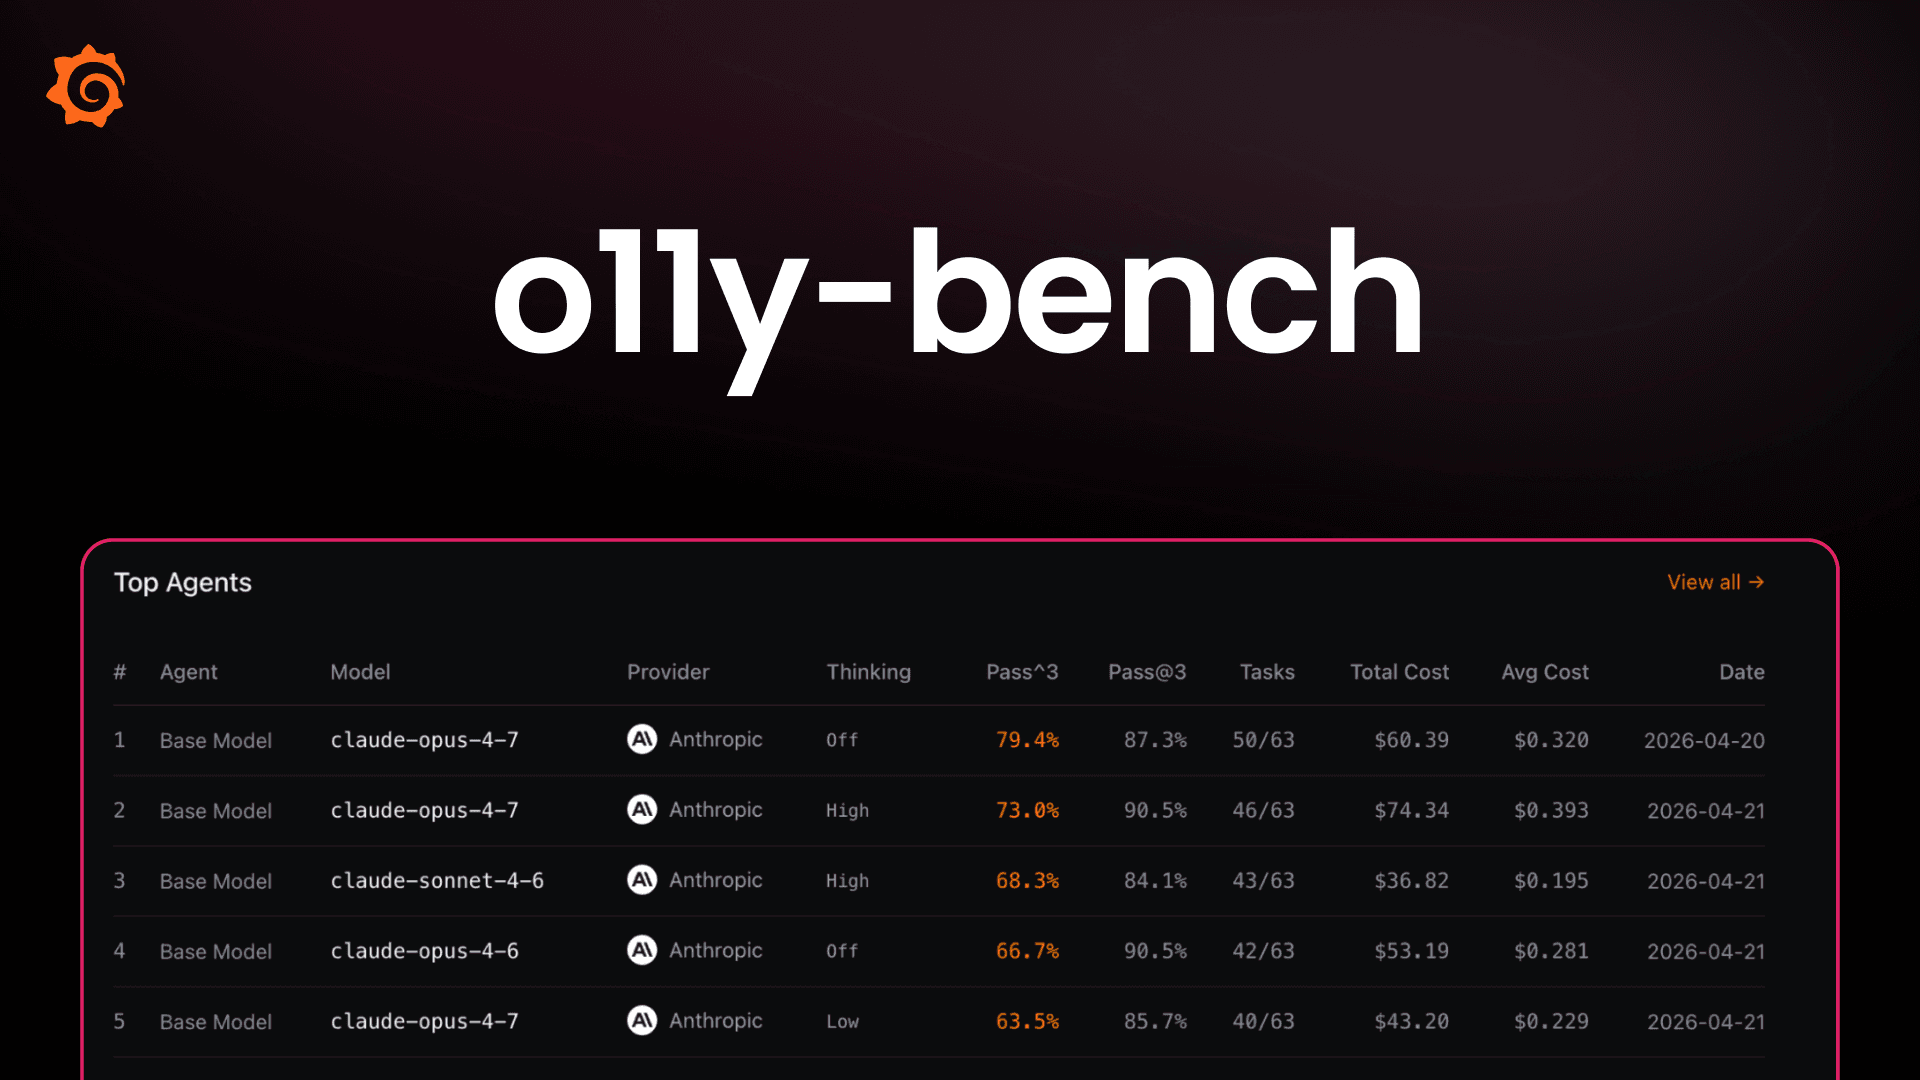
Introducing o11y-bench: an open benchmark for AI agents running observability workflows
Grafana open-sourced o11y-bench, a benchmark for evaluating AI agents on observability workflows using a real Grafana stack with synthetic metrics, logs, and traces. The tool grades agents on 63 tasks…
- Acquisitiongrafana.com
Grafana Labs acquires Logline to accelerate needle-in-the-haystack log queries
Grafana Labs acquired Logline to enhance Loki’s log query capabilities, particularly for high-cardinality searches. Logline’s indexing approach reduces data scanned for unique values (e.g., UUIDs) by …
- Launchgrafana.com
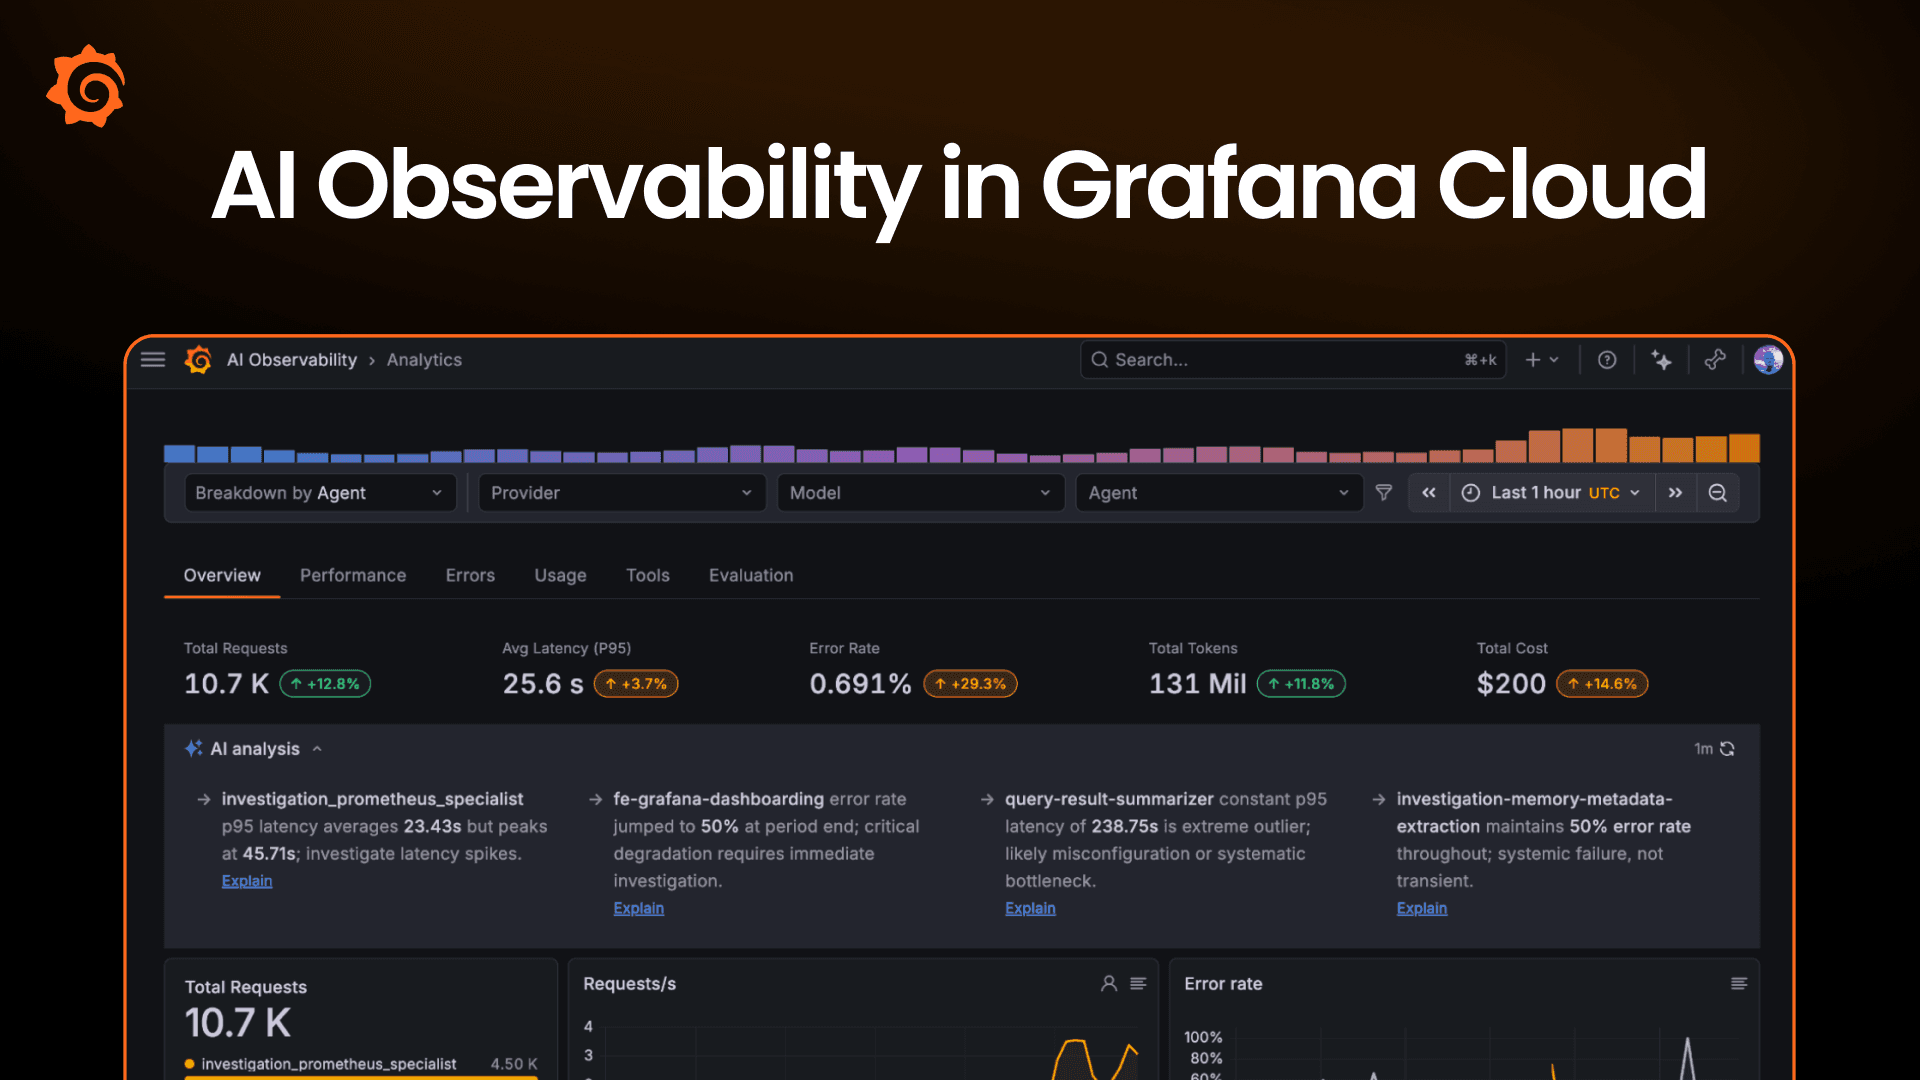
AI Observability in Grafana Cloud: A complete solution for monitoring your agentic workloads
Grafana launched AI Observability in Grafana Cloud, a new solution for monitoring agentic workloads in production. Available now in public preview, the tool captures agent traces, tool calls, token us…
- Launchgrafana.com
Grafana 13 release: get value from your data faster, manage operations at scale, and more!
Grafana 13 introduces major improvements to speed up data insights, dashboard creation, and operational scalability. Key changes include AI-powered Grafana Assistant for dashboard customization and SQ…

- grafana.com
Grafana launched AI Observability in Grafana Cloud, a public preview feature designed to monitor agentic workloads in production. The solution addresses gaps in traditional observability by capturing
- grafana.com
Grafana open-sourced o11y-bench, a benchmark for evaluating AI agents on observability workflows using a real Grafana stack with synthetic metrics, logs, and traces. The tool tests agents on 63 tasks
- Featuregrafana.com
Error Fingerprinting in Frontend Observability
Grafana Labs launched error fingerprinting in Frontend Observability to group errors by root cause, reducing alert noise and improving prioritization. The feature uses a four-layer cascading strategy …
- Featuregrafana.com
Simplify organization and access with Team folders
Grafana Labs introduced Team folders to simplify organization and access for teams. Team folders associate folders with teams, surfacing owned content at the top of the Dashboards page and in team det…
- Featuregrafana.com
Team Folders
Grafana Labs introduced Team Folders in public preview, allowing teams to organize dashboards, library panels, and alert rules under a dedicated folder associated with their team. Folders owned by a t…
- Featuregrafana.com
Grafana Assistant becomes available on-prem
Grafana Labs announced that Grafana Assistant is now available for on-premises deployments, extending its AI capabilities to Grafana Enterprise and Grafana OSS users. Self-managed users can connect th…
- Integrationgrafana.com
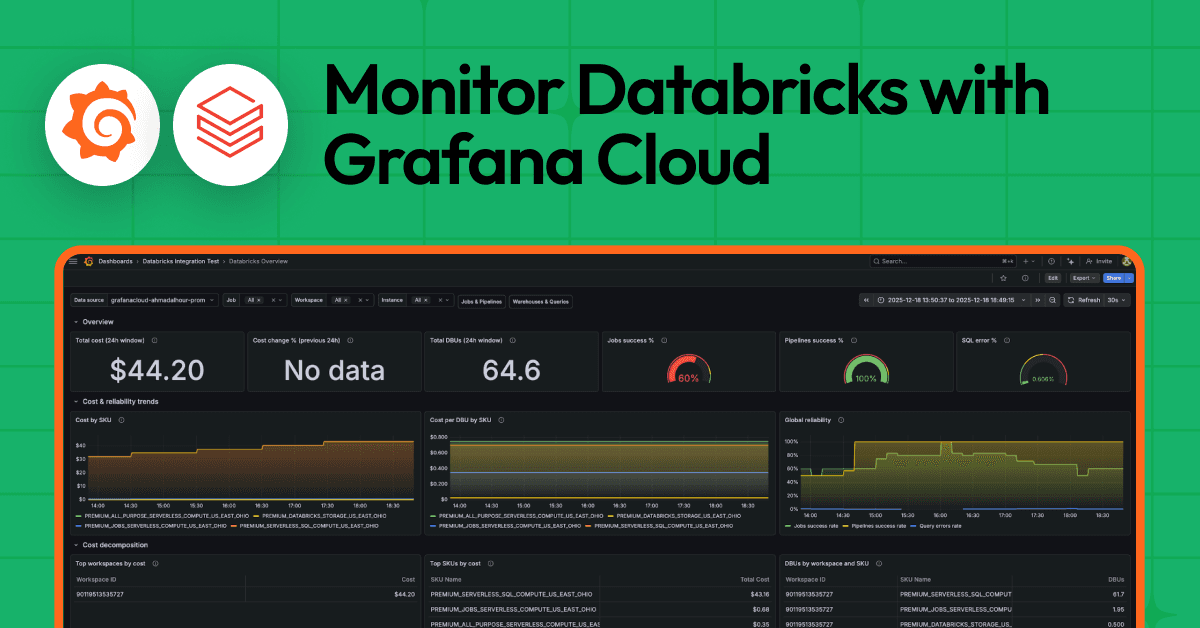
Monitor Databricks with Grafana Cloud for instant visibility into your workloads
Grafana Labs launched a Databricks integration for Grafana Cloud, enabling real-time visibility into Databricks workloads through prebuilt dashboards and alerting rules. The integration pulls metrics …
- grafana.com
Grafana Labs launched a Databricks integration for Grafana Cloud, enabling real-time visibility into Databricks workloads by pulling metrics directly from Databricks workspaces. The integration provid
- grafana.com
Grafana Labs launched a Databricks integration for Grafana Cloud, enabling real-time monitoring of Databricks workloads with prebuilt dashboards and 14 alerting rules. The integration pulls metrics fr
- Featuregrafana.com
Deprecation of /api path
Grafana Labs announced the deprecation of the /api path in favor of /apis, a Kubernetes-style API layer introduced in Grafana 13. The /api endpoints will remain fully accessible and functional but wil…
- grafana.com
Git Sync for Grafana dashboards and folders now Generally Available
Grafana Labs announced the general availability of Git Sync for dashboards and folders, enabling users to connect Grafana instances to GitHub, GitLab, Bitbucket, or any git repository to manage dashbo…
- Featuregrafana.com
Better security with Grafana Assume Role for AWS data sources
Grafana Labs released AWS Grafana Assume Role support for its AWS data sources in Grafana Cloud, now generally available. The feature replaces long-lived AWS access keys with short-lived, scoped crede…
- Featuregrafana.com
Precise log filtering with Adaptive Logs Drop rules
Grafana Labs introduced Adaptive Logs Drop rules, enabling precise filtering of noisy or wasteful logs such as debug logs, health checks, or downsampling in non-production environments. The feature is…
- Pricinggrafana.com
Pricing updated for Grafana: - New tier: Grafana Cloud Free ($0/mo) - New tier: Grafana Cloud Pro (Platform) ($19/mo) - New tier: Grafana Cloud Enterprise (Platform) (Custom pricing) - New tier: Grafa
- Featuregrafana.com
Create k6 tests with Grafana Assistant and k6 Script Authoring mode
Grafana Labs introduced k6 Script Authoring mode in Grafana Assistant, enabling users to generate production-ready k6 performance test scripts from plain-language prompts or existing stack data. The f…
- Featuregrafana.com
Kubernetes Monitoring Helm chart v4: Biggest update ever!
Grafana has released Kubernetes Monitoring Helm chart v4.0, the most significant update to the chart to date, addressing longstanding pain points for users managing one or hundreds of Kubernetes clust…
- Featuregrafana.com
What's new in the Grafana Image Renderer: higher-quality results, security enhancements, and more
Grafana released v5.0 of its Image Renderer, a backend service that converts Grafana dashboards and panels into images (PNGs, PDFs) for sharing outside the platform. The update includes a complete rew…
- Featuregrafana.com
React 19 is coming to Grafana: what plugin developers need to know
Grafana will update to React 19 in its April Grafana 13 release, aligning with the latest major version of the frontend library to leverage performance improvements and new APIs. The change primarily …
- Featuregrafana.com
Create an alert based on Grafana Advisor results
Grafana has introduced a new capability to create alerts based on results from Grafana Advisor, a tool that performs automated checks on data sources, plugins, and Grafana instances. Users can now set…
- grafana.com
Your guide to GrafanaCON 2026 in Barcelona
GrafanaCON 2026, Grafana Labs’ largest community conference, will be held in Barcelona on April 20–22, 2026, featuring over 30 sessions, hands-on labs, technical deep dives from partners like Google a…

- grafana.com
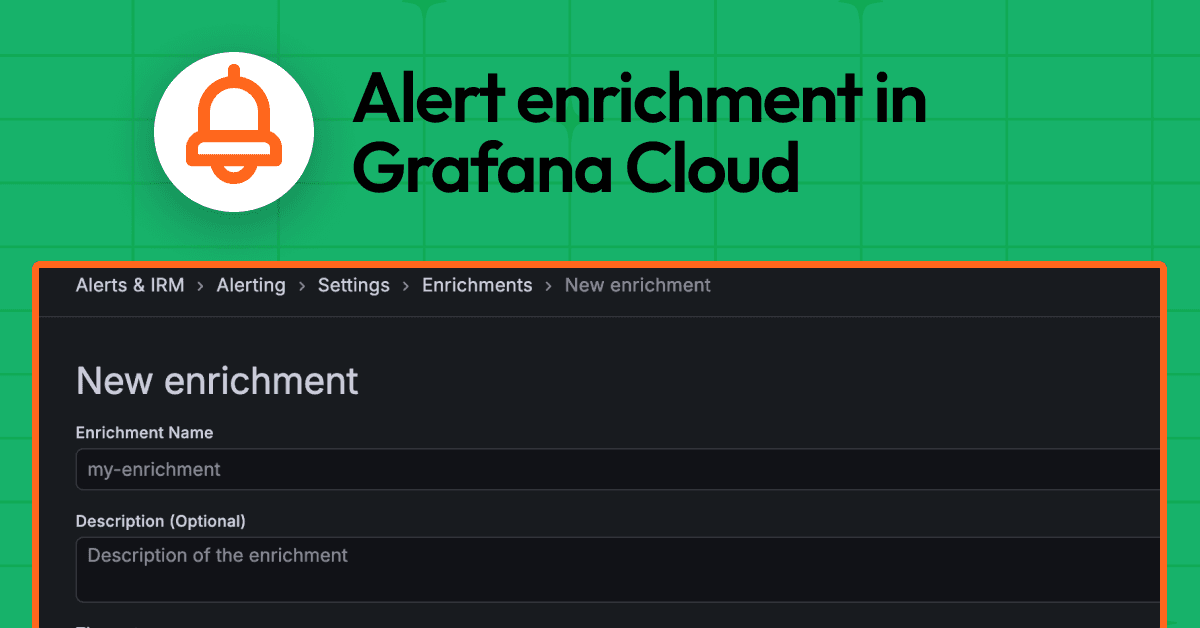
Grafana Alerting: Respond faster and get situational awareness with alert enrichment in Grafana Cloud
Grafana Cloud introduced alert enrichment, a new feature in public preview that adds contextual information to alerts to improve incident response. Previously, alerts lacked sufficient context, forcin…
- grafana.com
GrafanaCON 2026, Grafana Labs’ largest community conference, will be held in Barcelona on April 20–22, 2026, featuring major announcements around open source observability, AI developments, and Grafan
- Sunsetgrafana.com
Grafana database metrics deprecation
Grafana Labs announced the deprecation of 18 Prometheus metrics related to database connections in Grafana v13, which will be removed in a future release. The deprecated metrics include legacy names l…
- Featuregrafana.com
Rendering: Default auth mode changed to use JWTs
Grafana Labs changed the default authentication mode for its Image Renderer from opaque database-stored tokens to stateless JSON Web Tokens (JWTs) in Grafana v13.0. Previously, the renderer relied on …
- Sunsetgrafana.com
Removal of grafana-cli and grafana-server commands
Grafana Labs will remove the deprecated `grafana-cli` and `grafana-server` commands in Grafana v13.0, effective April 14, 2026. These commands were previously deprecated in Grafana v10.0 in favor of t…
- Sunsetgrafana.com
Removal of deprecated components from @grafana/ui
Grafana Labs will remove several deprecated components from the @grafana/ui package in version 13.0, scheduled for release on April 14, 2026. The affected components include Graph, GraphWithLegend, Gr…
- Featuregrafana.com
HTTP compression now enabled by default
Grafana Labs has enabled HTTP compression by default in Grafana v13.0, changing the previous default setting where compression was disabled and required manual activation. The enable_gzip configuratio…
- Featuregrafana.com
Grafana Advisor is now generally available-health checks for your Grafana instance to keep things running smoothly
Grafana Advisor has reached general availability in Grafana v13.0, introducing automated health checks for Grafana instances to proactively identify and resolve issues. The tool scans for failing data…
- Sunsetgrafana.com
Deprecated data source APIs disabled by default
Grafana Labs has disabled deprecated data source APIs by default in Grafana v13.0, replacing numeric ID references with UUID-based APIs introduced in v9.0. Users relying on legacy APIs can temporarily…
- Featuregrafana.com
Auditing: Changed defaults for data source queries audit logging settings
Grafana Labs changed the default settings for audit logging of data source query payloads in version 13, reversing the previous default of 'true' to 'false' for log_datasource_query_request_body and l…
- Featuregrafana.com
New panel: Graphviz
Grafana Labs introduced a new experimental Graphviz panel plugin on April 14, 2026, enabling users to create interactive diagrams using the Graphviz DOT language and map live data from any source. The…
- Launchgrafana.com
Unified storage for folders and dashboards
Grafana Labs is introducing unified storage for folders and dashboards in Grafana v13, replacing legacy SQL database tables with a new storage system. The migration, which runs automatically during st…
- Sunsetgrafana.com
Grafana Image Renderer plugin support removed
Grafana Labs has fully removed support for the Grafana Image Renderer plugin starting with Grafana 13, as announced in a September 2025 deprecation notice. The plugin, previously bundled with Grafana,…
- Featuregrafana.com
Copy and paste panel styles
Grafana Labs introduced a new feature allowing users to copy and paste panel styles between panels in Grafana dashboards. Previously, styling required manual editing or duplicating panels, but this up…
- Featuregrafana.com
SQL Expressions support in Grafana Assistant
Grafana Labs introduced SQL Expressions support in Grafana Assistant, enabling users to describe cross-query data tasks in natural language and have the AI generate correct SQL syntax automatically. P…
- Featuregrafana.com
Faster dashboard exploration with quick filters and grouping
Grafana Labs introduced unified dashboard controls for faster data exploration, replacing ad hoc variables with a single Filter and Group by interface. This change allows users to filter and group dat…
- Featuregrafana.com
Query your Elasticsearch data with more flexibility using DSL and ES|QL
Grafana Labs introduced native support for Elasticsearch Query DSL and ES|QL in its data source integration, enabling advanced raw query editing for Elasticsearch data. Users can now bypass visual que…
- Sunsetgrafana.com
TwinMaker SceneViewer panel unavailable
Grafana v13.0 removes React 18 APIs required by the IoT TwinMaker SceneViewer panel, causing dashboards with this panel to display errors after upgrading. The change directly affects users relying on …
- Featuregrafana.com
Grafana has released Kubernetes Monitoring Helm chart v4.0, the most significant update to the chart to date, addressing longstanding pain points for users managing monitoring setups across one or hun
- Contentgrafana.com
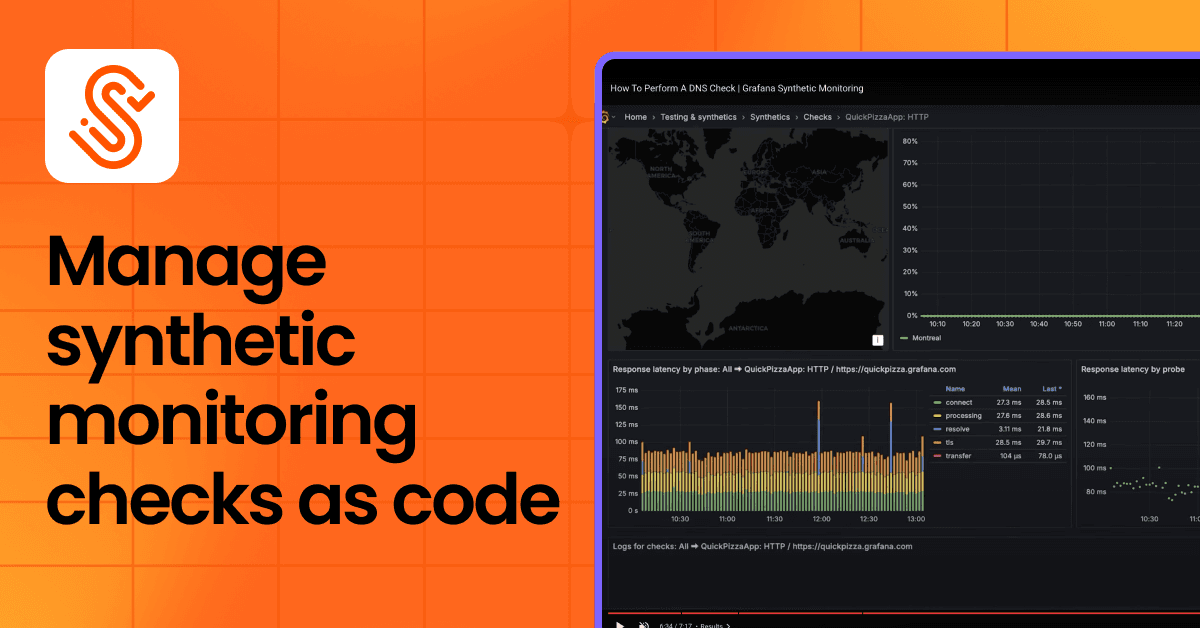
How to manage synthetic monitoring checks as code with Terraform and Grafana Cloud
Grafana Cloud now supports managing synthetic monitoring checks as code using Terraform, enabling teams to define, version, and deploy checks programmatically instead of manually via the UI. This chan…
- grafana.com
Grafana introduced a new capability to manage Synthetic Monitoring checks as code using Terraform, enabling teams to define, version, and deploy monitoring configurations programmatically. This change
- grafana.com
A faster way to pinpoint performance bottlenecks: Using Profiles Drilldown with Grafana Cloud Knowledge Graph
Grafana has integrated Profiles Drilldown with Grafana Cloud Knowledge Graph, enabling users to explore CPU and memory profiling data through an intuitive, point-and-click interface without writing co…

- Featuregrafana.com
Grafana has integrated its Profiles Drilldown tool with Grafana Cloud Knowledge Graph, enabling users to investigate performance bottlenecks more efficiently. The integration allows developers to expl
- Featuregrafana.com
Custom tabs in Frontend Observability (Experimental)
Grafana Labs introduced experimental custom tabs in Frontend Observability, allowing teams to add direct links to any Grafana dashboard within the Frontend Observability interface. Configured via the …
- Featuregrafana.com
Prefix/suffix exemptions for Adaptive Metrics
Grafana Labs has introduced a new feature for Adaptive Metrics, allowing users to create prefix and suffix exemptions for easier configuration of metric exemptions. This quality-of-life improvement si…
- Pricinggrafana.com
Send more, charge more is broken. We are changing it.
Grafana has fundamentally overhauled its pricing model for Grafana Cloud, replacing the previous 'send more, charge more' approach with a new adaptive, composable, and open observability platform that…
- Contentgrafana.com
Technical documentation
Grafana Labs has expanded its observability platform with enhanced AI-powered capabilities, including built-in AI and machine learning features, a Grafana Assistant, and dynamic alerting tools like an…
- Launchgrafana.com
Get started with Grafana
Grafana has introduced GrafanaCloud, a managed service offering the full open-source observability stack without operational overhead. The platform provides a 14-day unlimited trial with all Grafana C…
- grafana.com
Restore deleted dashboards is now generally available
Grafana Labs has announced the general availability of the 'Restore deleted dashboards' feature, a significant enhancement to its dashboard management capabilities. Previously, deleted dashboards were…
- Eventgrafana.com
Intro to Alerting with Grafana (APAC Timezone)
Grafana is offering a webinar focused on alerting, emphasizing its importance in observability and incident response. The webinar aims to teach participants how to alert on critical signals and servic…
- grafana.com
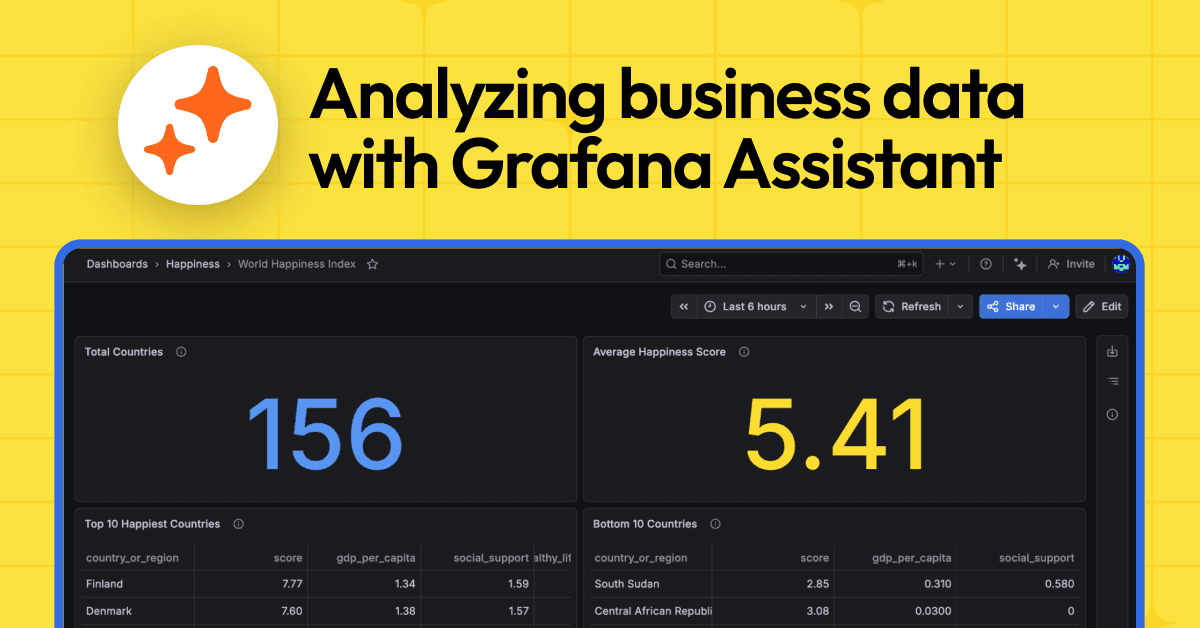
Business metrics in Grafana Cloud: Get an AI assist to help securely analyze your data
Grafana Cloud has introduced a new capability that enhances its observability platform by enabling secure, AI-assisted analysis of private business data. The update centers on Private Data Source Conn…
- Featuregrafana.com
Grafana Cloud has introduced a new capability that combines Private Data Source Connect (PDC) with its AI-powered Grafana Assistant to enable secure, natural-language analysis of proprietary relationa
- Featuregrafana.com
Grafana Cloud has introduced a new capability that combines Private Data Source Connect (PDC) with its AI-powered Grafana Assistant to enable secure, natural-language analysis of proprietary business
- Pricinggrafana.com
Pricing updated for Grafana: - Free: Custom pricing → $0/mo - Free: now includes All Grafana Cloud services, with limited usage; 10k active series/month (Metrics); 50 GB ingested/month (Logs, Traces,
- Featuregrafana.com
Manage and use secrets in Grafana Cloud k6
Grafana Labs has introduced Secrets Management for Grafana Cloud k6, now available in public preview as of April 8, 2026. This new feature enables users to securely store and manage sensitive values l…
- Featuregrafana.com
Dynamic dashboards is now generally available
Grafana Labs has announced the general availability (GA) of Dynamic Dashboards, which are now enabled by default for all Grafana Cloud users and self-managed Grafana instances. The new feature introdu…
- Featuregrafana.com
Stop juggling dashboards with grouping-level variables
Grafana Labs introduced grouping-level variables in Grafana Cloud, public preview, and Enterprise, released on April 8, 2026. This feature allows users to assign independent filters to specific rows o…
- grafana.com
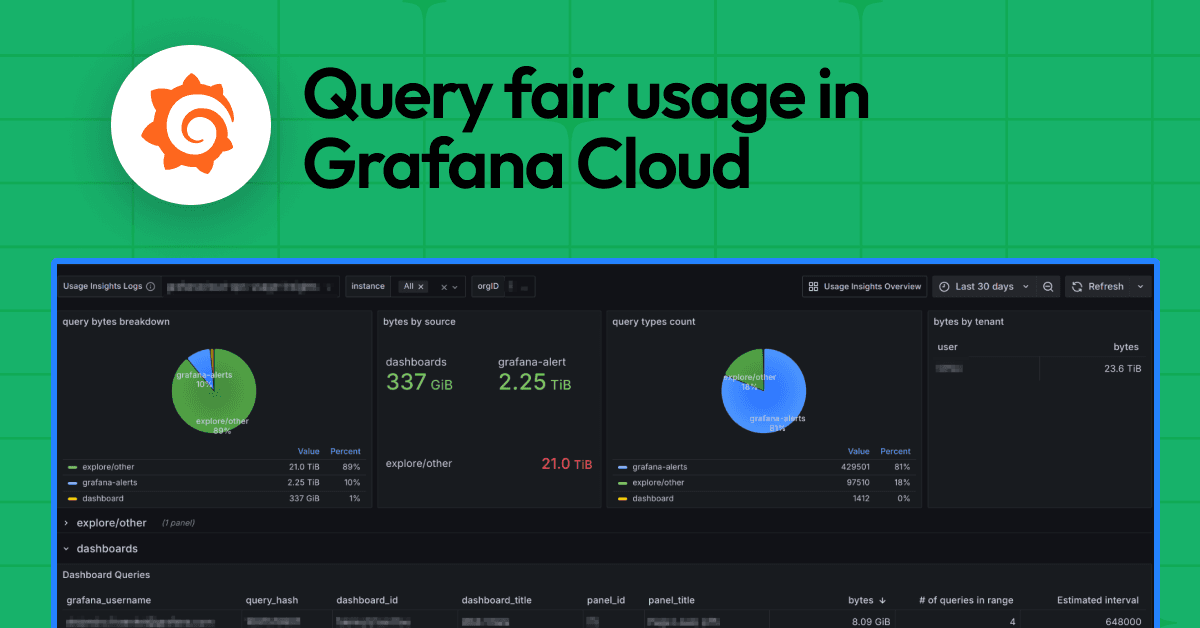
Query fair usage in Grafana Cloud: What it is and how it affects your logs observability practice
Grafana Cloud has introduced a 'query fair usage' policy to manage billing for log queries, allowing customers to query up to 100 times their monthly ingested log volume in gigabytes without additiona…
- Pricinggrafana.com
Grafana Cloud has introduced a 'query fair usage' policy to manage billing for log queries, allowing customers to query up to 100 times their monthly ingested log volume in gigabytes (GB) without addi
- Featuregrafana.com
Introducing limits to dashboards and folders resources
Grafana Labs is introducing hard and soft limits on dashboards and folders to support its transition to a multi-tenant architecture, ensuring predictable performance. Free-tier stacks will face a hard…
- Featuregrafana.com
Added provenance support to alerting notification app platform APIs
Grafana Labs introduced provenance support for alerting notification app platform APIs, addressing a critical gap in Kubernetes-style API enforcement. Previously, the `grafana.com/provenance` annotati…
- Sunsetgrafana.com
Legacy Alertmanager configuration API endpoints changed
Grafana Labs has removed or restricted access to several legacy Alertmanager configuration API endpoints in Grafana v13.0, following their deprecation in v12.0. The fully removed endpoints include DEL…
- Featuregrafana.com
Customize suggested dashboards with Grafana Assistant
Grafana Labs has introduced a new capability in Grafana Assistant that allows users to customize suggested dashboards directly within the assistant interface. This feature, available in public preview…
- grafana.com
Customize suggested dashboards with Grafana Assistant + feature improvements
Grafana Labs has introduced a new feature that allows users to customize suggested dashboards directly using Grafana Assistant, enhancing the usability of dashboard recommendations. This update enable…
- grafana.com
Observability in Go: Where to start and what matters most
The article is a transcript of a podcast episode from Grafana Labs’ “Grafana’s Big Tent” series, focusing on observability in Go programming. The discussion centers on practical strategies for impleme…

- grafana.com
The article discusses a podcast episode from Grafana Labs’ 'Grafana’s Big Tent' series, focusing on observability in Go programming. The discussion centers on practical strategies for implementing obs
- Featuregrafana.com
Effective configuration in Fleet Management
Grafana Labs has introduced a new 'effective configuration' feature for its Fleet Management tool, addressing a critical gap in remote configuration monitoring. Previously, Fleet Management relied on …
- Featuregrafana.com
Create panels instantly from saved queries and visualization suggestions
Grafana Labs has introduced a new feature that allows users to create dashboard panels instantly from saved queries and visualization suggestions. Released on April 3, 2026, this update redesigns the …
- Sunsetgrafana.com
Pre-Scenes architecture feature toggle removal
Grafana Labs has removed the ability to disable the Scenes-powered architecture for dashboards in Grafana v11, making it permanently enabled. Previously, users could opt out of this architecture, whic…
- Featuregrafana.com
Grafana 12.4 release: faster and easier data visualization, observability as code updates, and more
Grafana 12.4 introduces significant enhancements to its data visualization and observability platform, focusing on faster dashboard creation, improved scalability, and more intuitive user experiences.…
- grafana.com
Database Observability now Generally Available
Grafana has announced the general availability of Database Observability, a new feature that integrates MySQL and PostgreSQL query performance data directly into Grafana Cloud. This allows users to mo…
- Featuregrafana.com
Saved queries: New interface and improved filtering experience
Grafana Labs has updated its saved queries interface in Grafana Cloud and Enterprise offerings, replacing the saved queries drawer with a dialog box to provide more space for query details like titles…
- Eventgrafana.com
Getting started with continuous profiling with Grafana Cloud Profiles
Grafana Cloud Profiles introduces continuous profiling to optimize application performance by providing code-level visibility. This feature extends observability to individual lines of code, offering …
- Featuregrafana.com
Per-Stack Cost Visibility via CSV
Grafana has introduced a new feature that enhances cost visibility for its users by enabling per-stack cost tracking in billed usage CSV exports. The update allows organizations to view how individual…
- Featuregrafana.com
Revamped query editor experience
Grafana Labs has revamped its query editor experience, launching a redesigned interface to simplify the creation and management of complex data panels. The new editor unifies queries, expressions, tra…
Grafana 在 2026年4月 发布了 112 项受追踪的更新。 较 2026年3月 增长 23%。 这是 Grafana 在 2026 年最活跃的月份。 主要主题是 feature updates(56)。 活动主要集中在 2026年4月13日 那一周。 亮点:“Faster fixes, less context sharing: how Grafana Assistant learns your infrastructure before you even ask”(2026年4月30日)。
信号分类:2026年4月
56
feature updates
10
product launches
8
product sunsets
4
pricing updates
2
events
2
content pieces
1
new integrations
1
acquisitions
浏览 Grafana 的其他月份