- Eventgrafana.com
Intro to Kubernetes monitoring in Grafana Cloud
Grafana hosted a webinar on May 29, 2026, introducing Kubernetes monitoring capabilities in Grafana Cloud. The session highlighted how Grafana Alloy simplifies collecting Kubernetes metrics and logs, …
- Pricinggrafana.com
Pricing change detected for Grafana
Pricing updated for Grafana: - Free: now includes 10k active series/month (Metrics), 50 GB ingested/month (Logs/Traces/Profiles), 2,232 host hours + 37,944 container hours/month (Kubernetes Monitoring…
- grafana.com
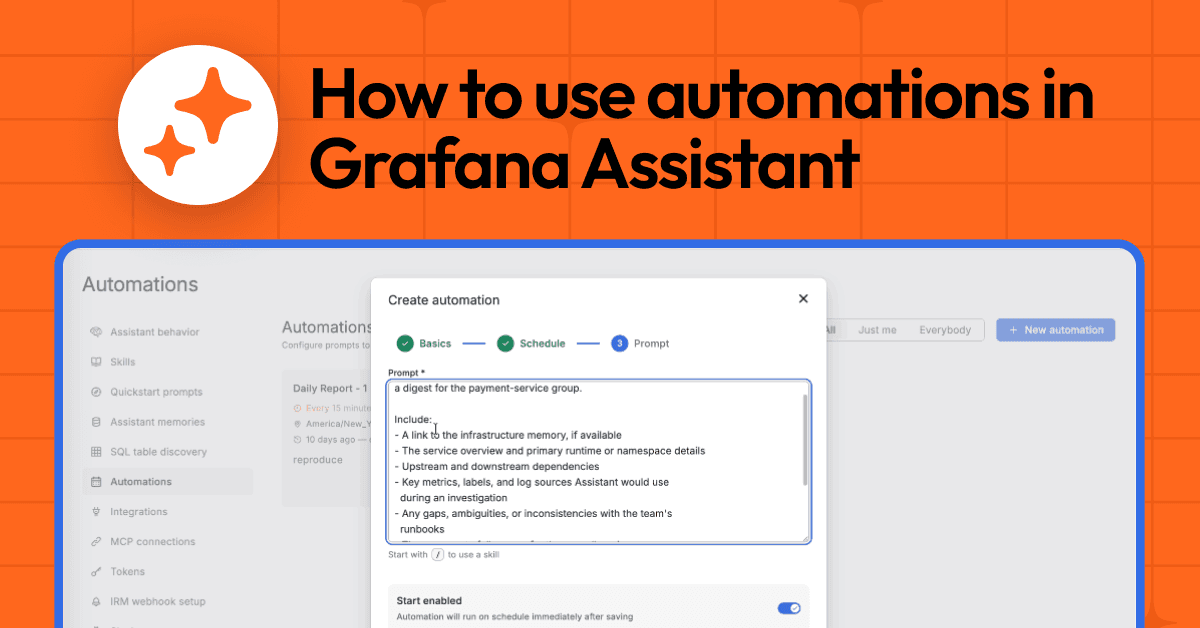
Spend less time on repetitive tasks with the new automation feature in Grafana Assistant
Grafana Assistant now offers automations in public preview, allowing teams to schedule recurring AI prompts for tasks like daily standups, on-call handoffs, and SLO reviews. Automations run background…
- Eventgrafana.com
Start with Grafana Assistant (APAC Timezone)
Grafana concluded a webinar on May 27, 2026, introducing Grafana Assistant, an AI guide in Grafana Cloud that enables natural-language queries, dashboard creation, and troubleshooting without PromQL. …
- Featuregrafana.com
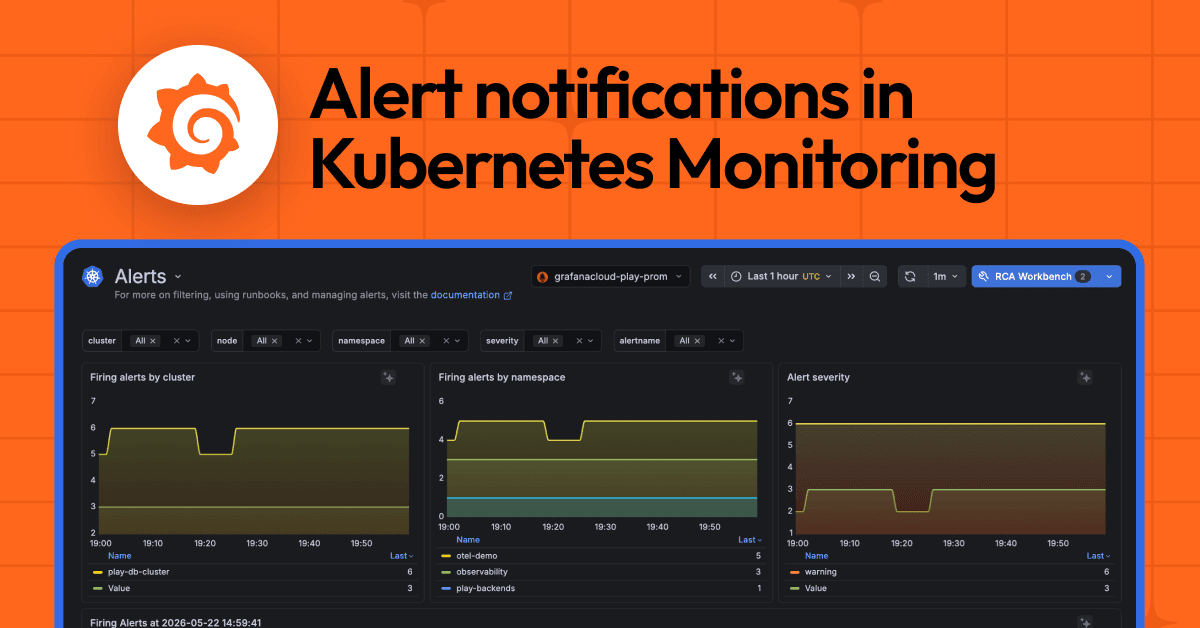
The inside scoop on alerting changes in Kubernetes Monitoring
Grafana Cloud is consolidating Kubernetes Monitoring alerting onto its Grafana-managed platform, replacing the older data source-managed system. Alert rules now default to Grafana-managed alerts, whic…
- Pricinggrafana.com
Pricing updated for Grafana: - New tier: Free ($0/mo) - New tier: Pro (On-demand) ($19/mo) - New tier: Enterprise (Annual) (Custom pricing) - New tier: Metrics - Free ($0/mo 1k series) - New tier: Met
- Launchgrafana.com
Real user monitoring in Grafana Cloud: Get frontend error tracking, faster root cause analysis, and more
Grafana Cloud introduced Frontend Observability, a real user monitoring (RUM) service now generally available to all users, including free-tier accounts. The offering provides instant insights into We…

- grafana.com
Generate test scripts from natural language with Grafana Assistant: introducing k6 Script Authoring
Grafana launched k6 Script Authoring in Grafana Assistant, enabling users to generate production-ready performance test scripts from natural language prompts, OpenAPI specs, or existing telemetry and …

- Launchgrafana.com
GrafanaCON 2026: On-demand sessions are now available
Grafana Labs unveiled major releases at GrafanaCON 2026, including Grafana 13 with dynamic dashboards and Git Sync, k6 v2.0 for AI-driven testing, Pyroscope 2.0 for scalable continuous profiling, and …
- Launchgrafana.com
Grafana 13 release: get value from your data faster, manage operations at scale, and more!
Grafana 13 introduces Grafana Assistant (AI-powered agent), dynamic dashboards (default for all users), refined visualization suggestions, and a redesigned query editor. The release also adds new pane…
- grafana.com
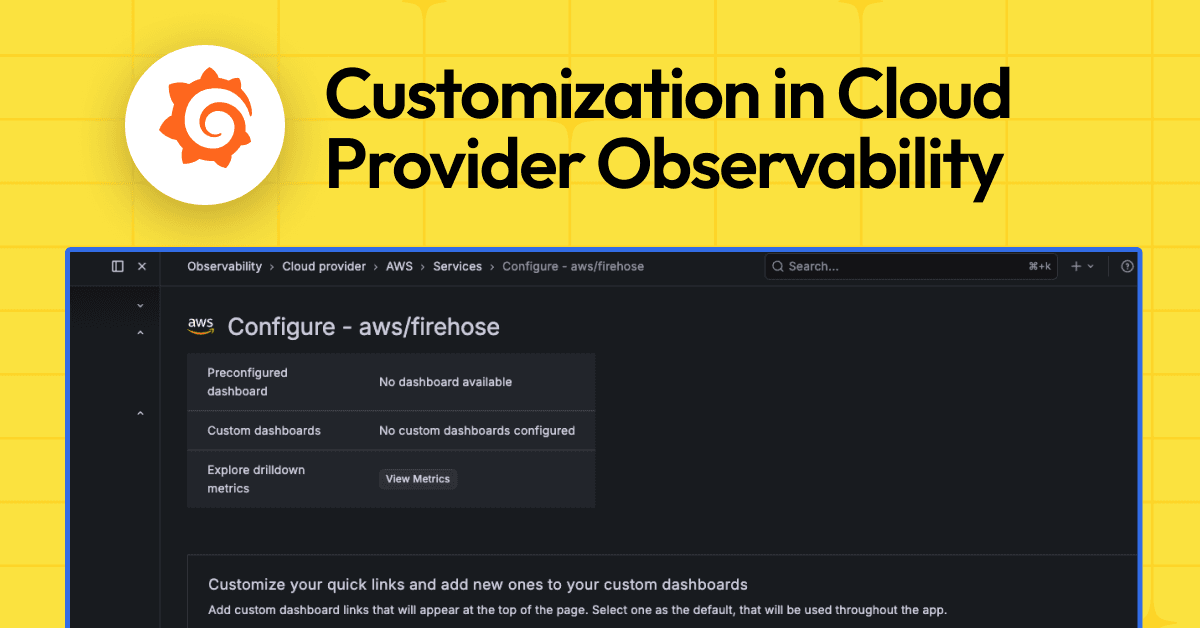
Grafana Assistant everywhere: Customize and connect to the AI agent to fit your specific needs
Grafana Assistant, its LLM-based observability agent, is now available in Grafana Enterprise and OSS via a one-click setup tied to a Grafana Cloud account. New features include customizable skills wit…
- grafana.com
GrafanaCON 2026 announcements: A guide to all the latest news from Grafana Labs
Grafana Labs unveiled Grafana 13 with AI-powered Assistant, dynamic dashboards, and Git Sync for GitOps workflows. Assistant is now available to self-managed users, and AI Observability was introduced…
- Securitygrafana.com
Grafana Labs security update: Latest on TanStack npm supply chain ransomware incident
Grafana Labs disclosed a May 2026 ransomware attack where cybercriminals accessed its GitHub repositories via a TanStack npm supply chain attack, demanding payment. The incident was limited to source …

- Featuregrafana.com
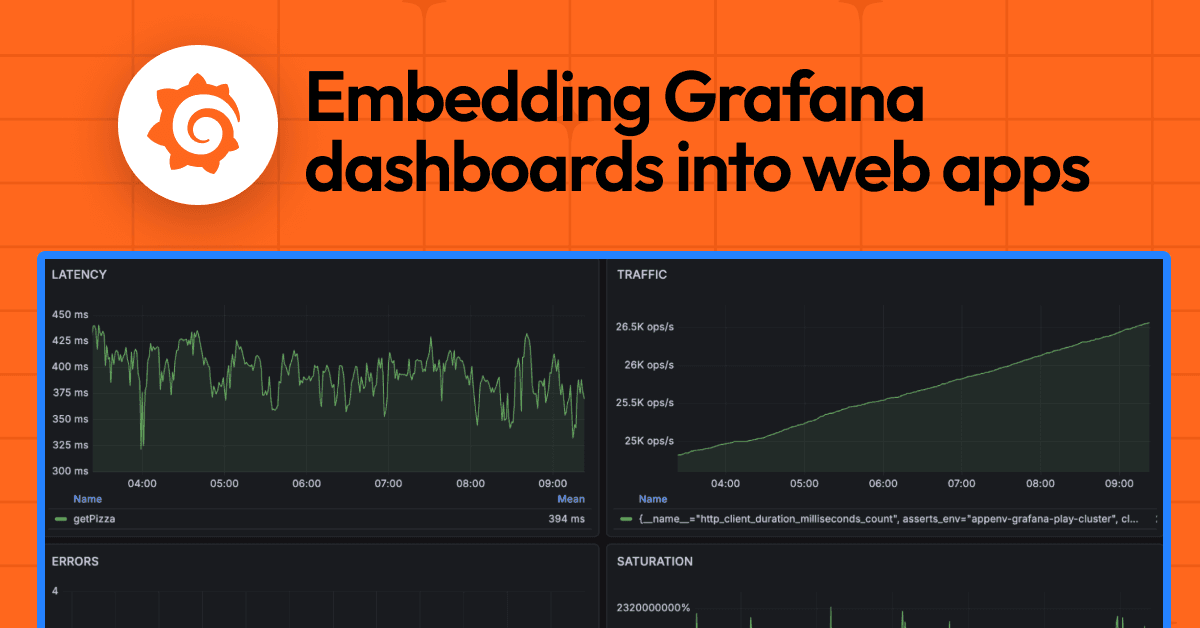
How to embed Grafana dashboards into web applications
Grafana updated its blog post to outline four methods for embedding dashboards into web applications: authenticated private dashboards, links, snapshots, and externally shared dashboards. The update h…
- Featuregrafana.com
Grafana documentation now available in markdown for AI workflows
Grafana Labs now provides every documentation page on grafana.com/docs as clean markdown, accessible by appending '.md' to any URL. This includes front matter and two index files for AI agents and cra…
- Integrationgrafana.com
Dell EMC PowerScale
Grafana released a new backend datasource plugin for Dell EMC PowerScale (formerly Isilon) that enables real-time and historical storage metrics visualization within Grafana panels. The plugin connect…
- Eventgrafana.com
Intro to Alerting with Grafana
Grafana Labs hosted a webinar on May 13, 2026, titled 'Intro to Alerting with Grafana,' covering simplified alerting, error budget alerts, adaptive alerts, and predefined alerting rules for integratio…
- grafana.com
Intro to metrics with Grafana: Prometheus, Grafana Mimir, and beyond (APAC Timezone)
Grafana Labs is hosting a webinar on May 13, 2026, focused on scaling metrics management for enterprises using Prometheus. The session highlights challenges in scaling Prometheus metrics, such as scal…
- Featuregrafana.com
Grafana adds Cost Attribution for Performance Testing in k6 projects
Grafana Labs introduced Cost Attribution for Performance Testing in its Cost Management and Billing app, enabling breakdown of Virtual User Hour (VUH) consumption by labels assigned to k6 projects. Th…
- Featuregrafana.com
Grafana Cloud Provider Observability adds enhanced AWS metrics for Lambda, DynamoDB, RDS, and ElastiCache
Grafana Labs introduced enhanced metrics for AWS services in Cloud Provider Observability, including derived metrics for Lambda, DynamoDB, RDS, and ElastiCache. These metrics provide deeper visibility…
- grafana.com
AI-assisted testing, extensions updates, and more: k6 2.0 is here
Grafana Labs launched k6 2.0, a major update to its open-source performance testing tool, introducing AI-assisted workflows, broader Playwright compatibility in the browser module, a new Assertions AP…
- Featuregrafana.com
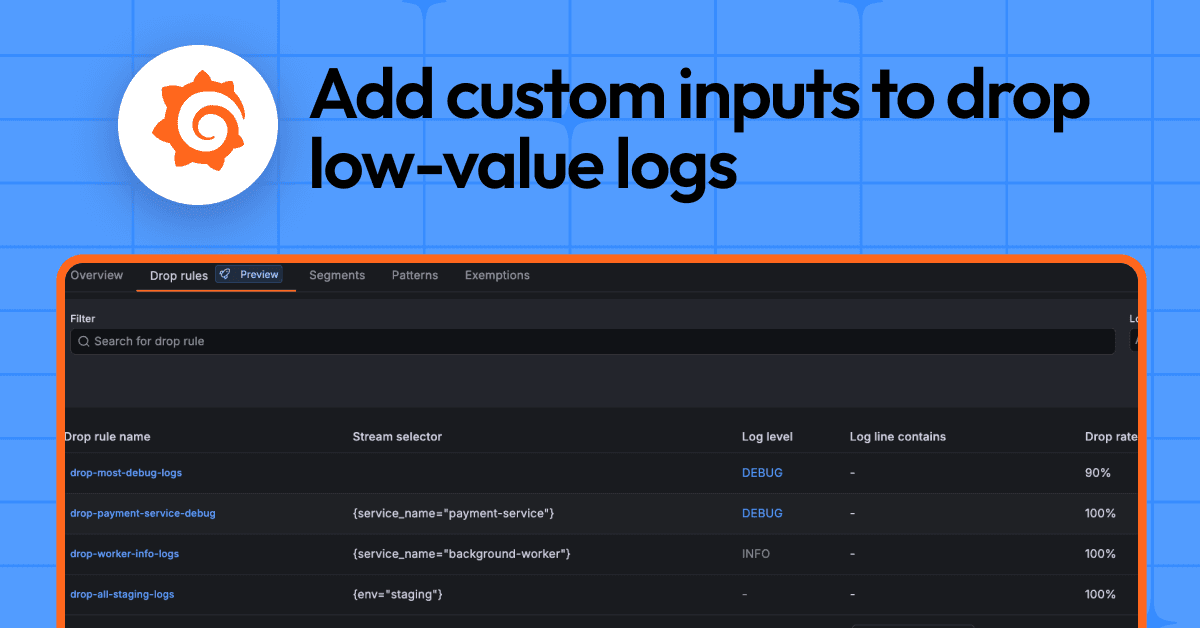
Eliminate noisy log lines with Adaptive Logs drop rules
Grafana launched drop rules in Adaptive Logs (public preview) to let platform teams define custom logic for dropping low-value logs before ingestion, reducing noise and costs. The feature complements …
- Featuregrafana.com
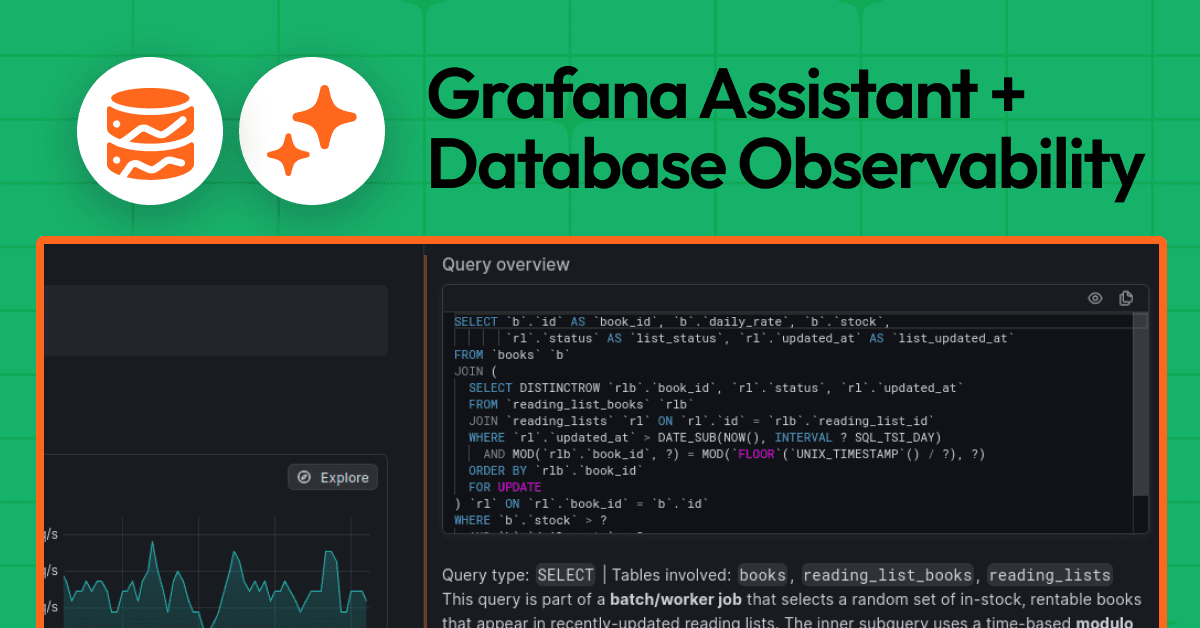
Troubleshoot performance issues faster with the new Grafana Assistant integration for Database Observability
Grafana introduced an AI-powered assistant for its Database Observability tool, enabling faster troubleshooting of slow queries by analyzing real-time metrics, schemas, and execution plans. The assist…
Grafana 在 2026年5月 发布了 36 项受追踪的更新。 较 2026年4月 下降 68%。 主要主题是 feature updates(11)。 活动主要集中在 2026年5月25日 那一周。 亮点:“The inside scoop on alerting changes in Kubernetes Monitoring”(2026年5月27日)。
信号分类:2026年5月
11
feature updates
4
events
4
product launches
2
pricing updates
2
security incidents
1
new integrations
浏览 Grafana 的其他月份